OUR FINDINGS
Use the "Categories" list to search our library of 35 Findings.
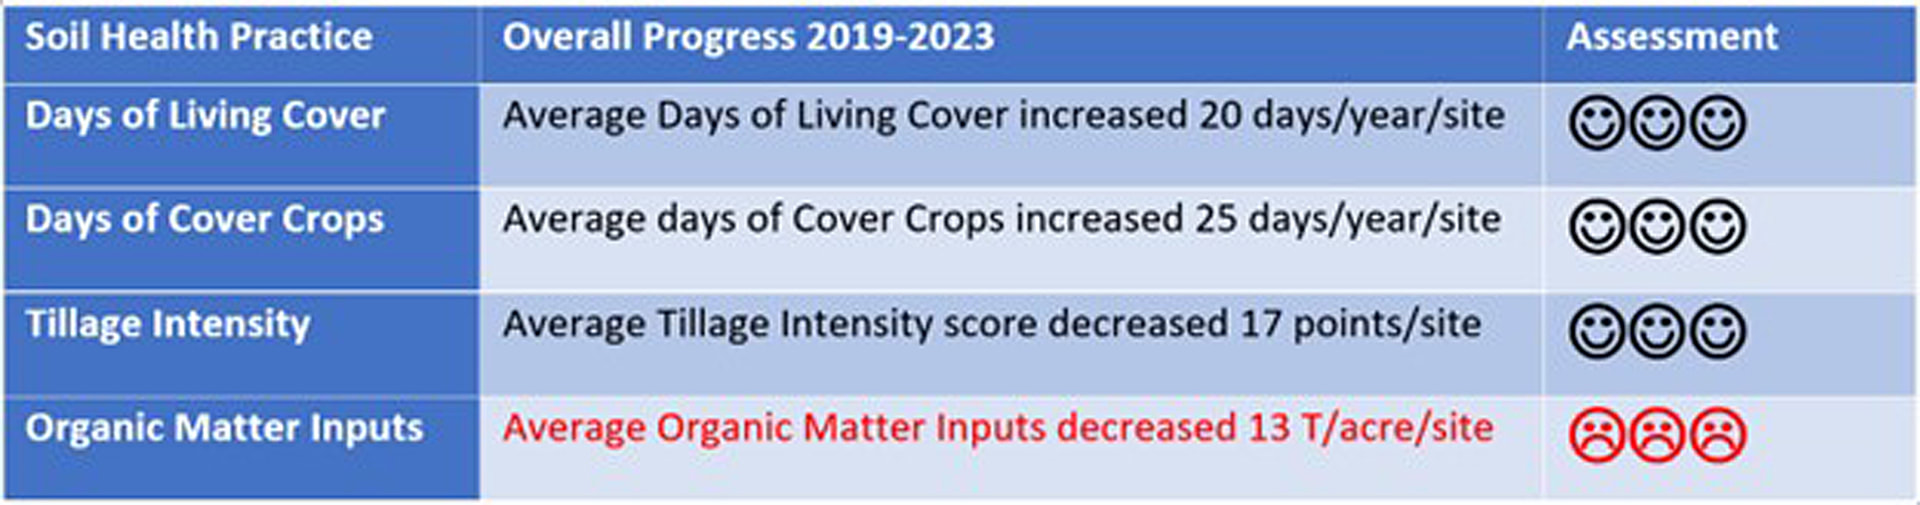 The variability we continue to see in our lab results has thrown a great big monkey wrench into our ability to assess progress using only our lab results. However, we can still assess the progress our growers have made in increasing their use of tried-and-true soil health practices, including:
0 Comments
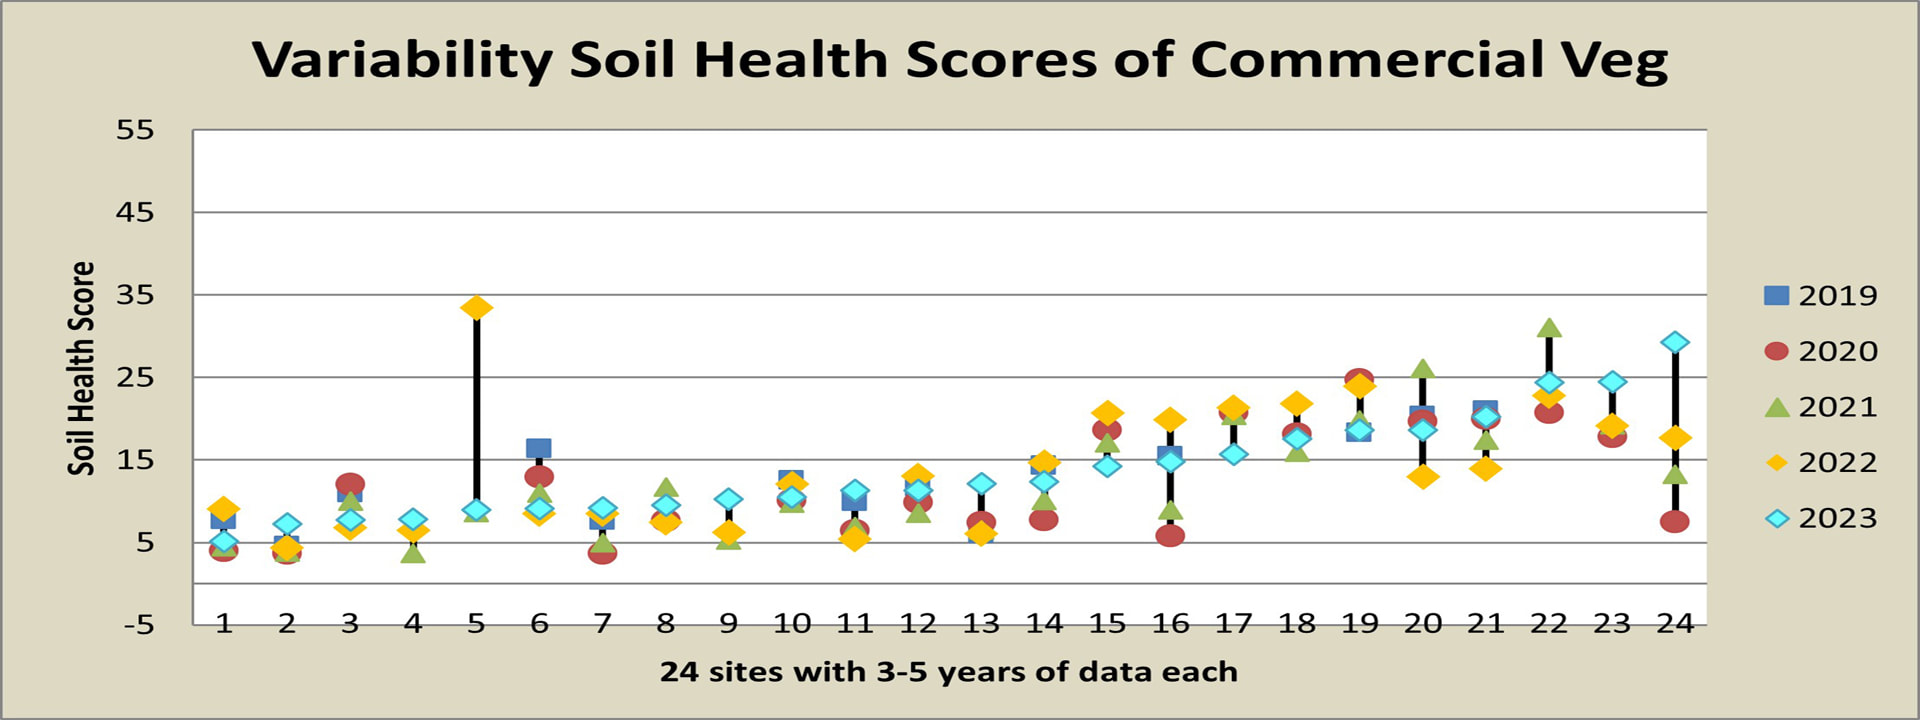 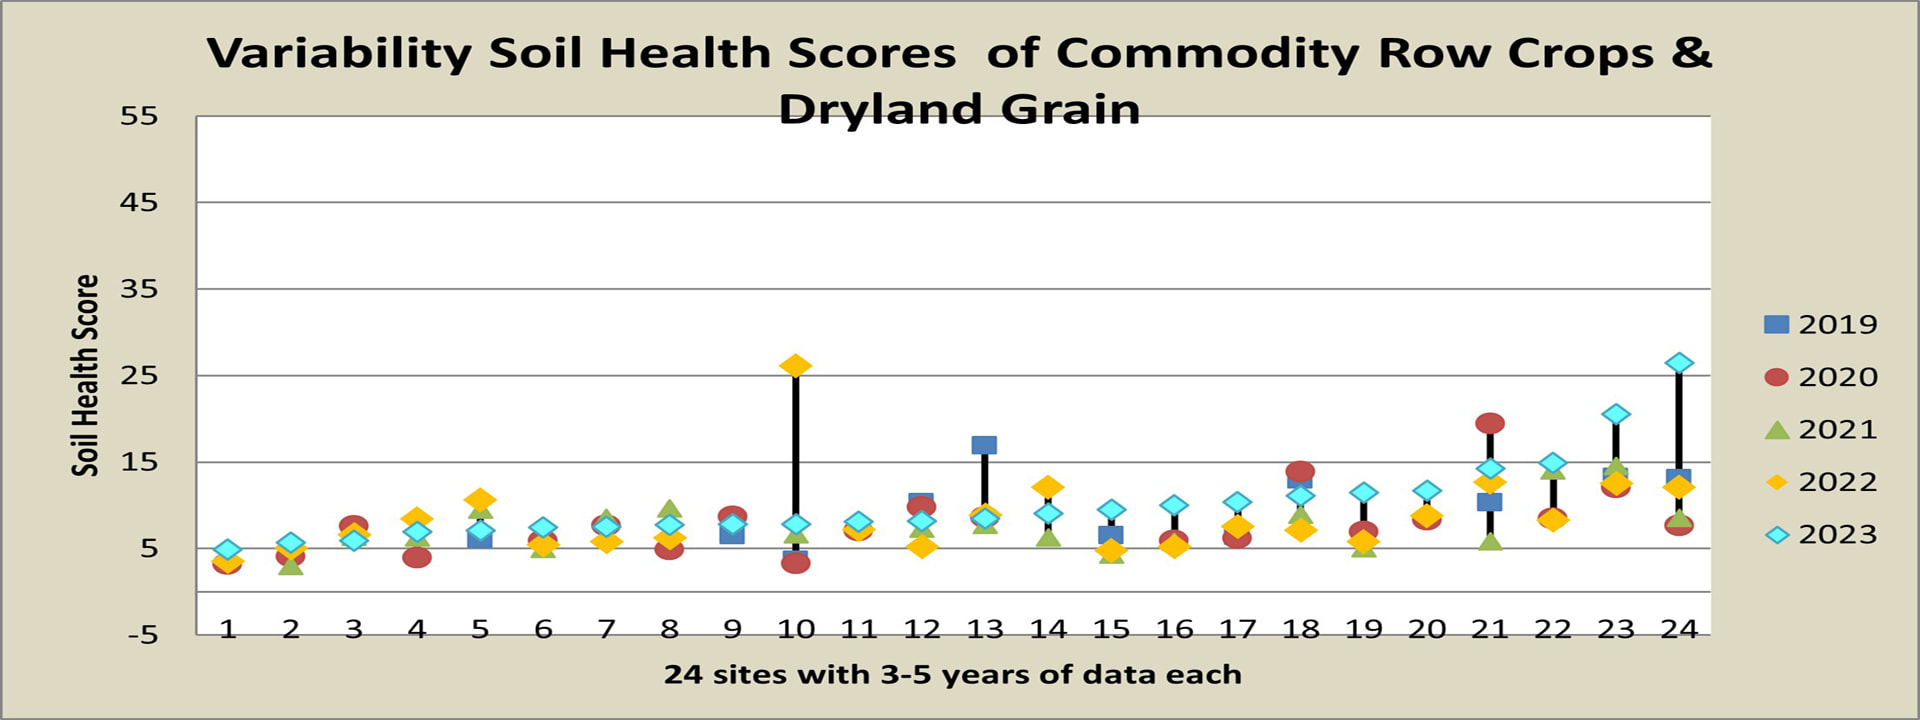 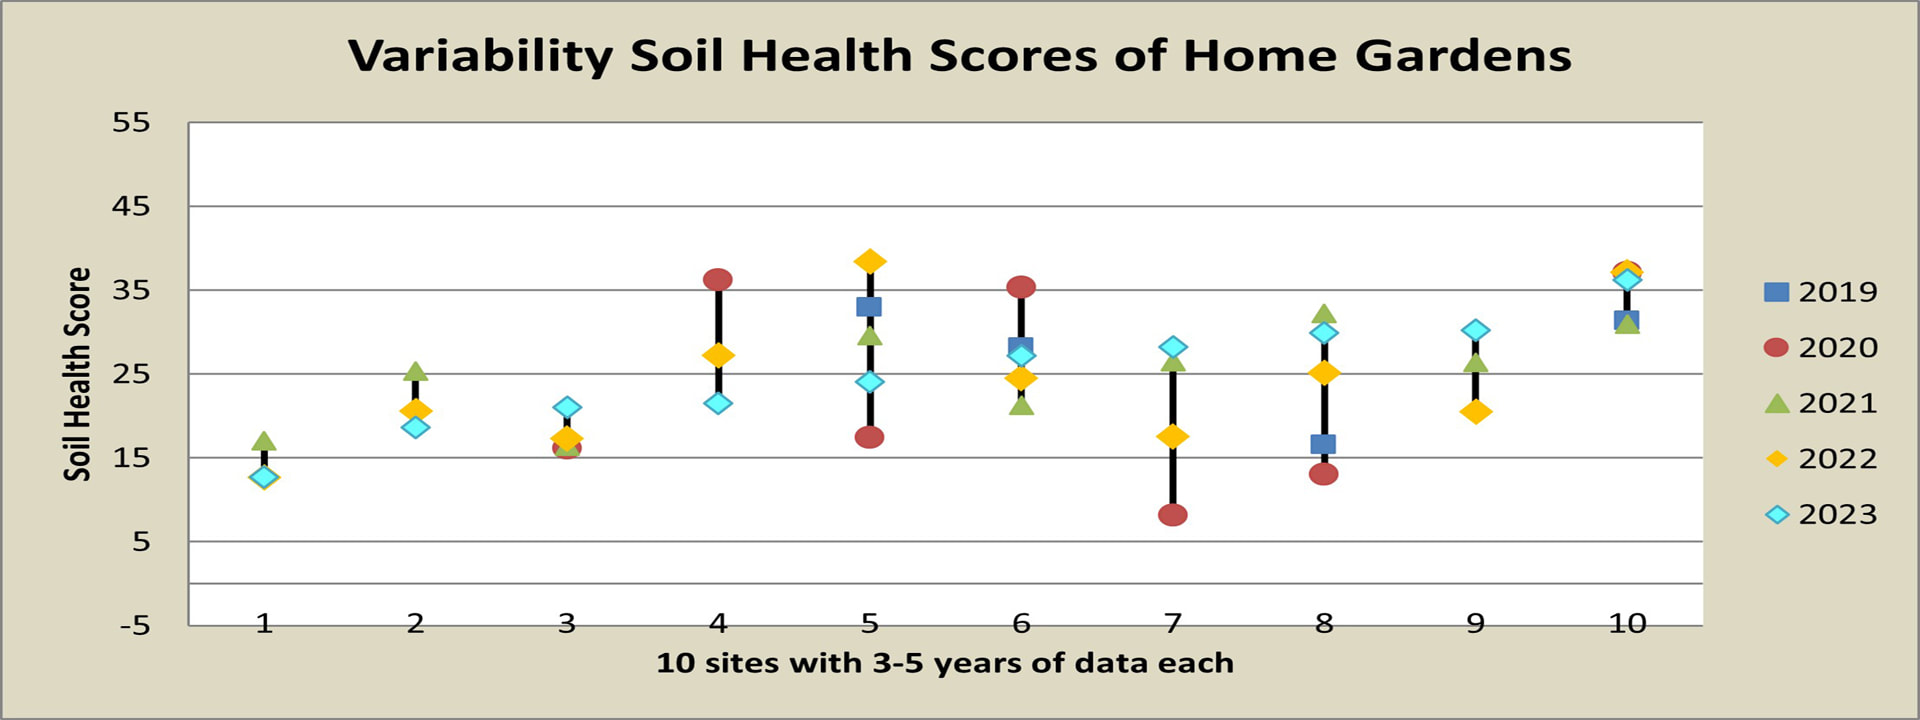 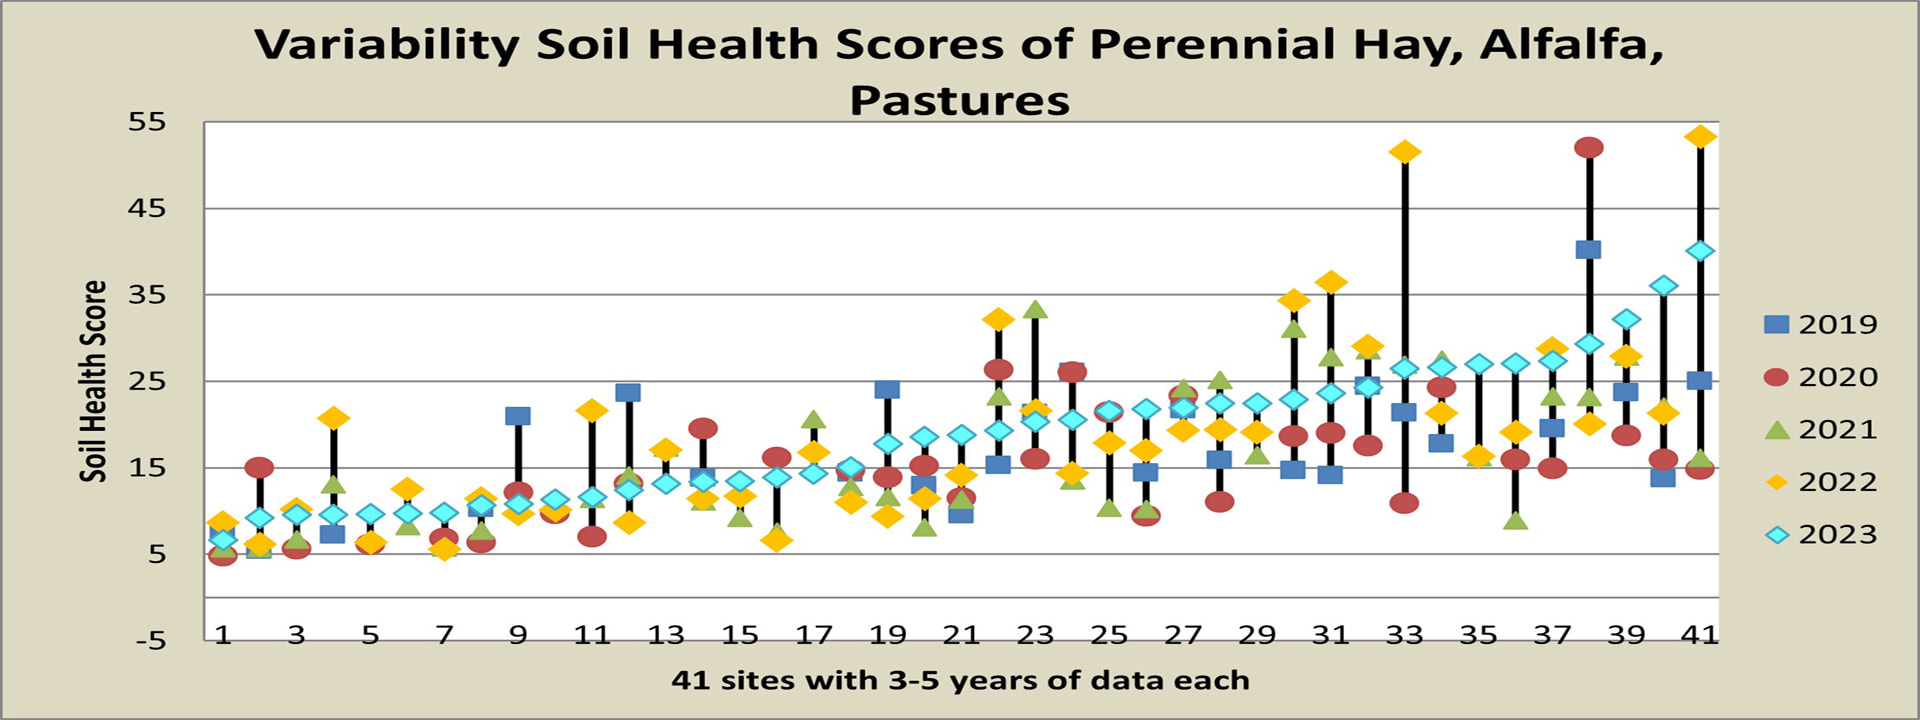 These 4 graphs show that Home Gardens and Perennial Hay/Alfalfa/Pastures have the most variable soil health scores year-to-year. Each site’s 3-5 years of soil health scores are represented by a column of 3-5 colored data points connected by a vertical black line (a blue square for 2019, red circle for 2020, green triangle for 2021, yellow diamond for 2022 and aqua diamond for 2023). Each square-circle-triangle-diamond-Blackline combo represents the Soil Health Scores for one site for 3-5 years. Sites with the most variability have the tallest black lines between their lowest and highest scores.
Last year we showed that large amounts of organic matter inputs and more days of grazing animals increased variability. This year we have shown that home gardeners apply the highest rates of organic matter to their sites, and we know that grazing animals are usually found in pastures. It makes sense then that Home Gardens and Perennial Hay/Alfalfa/Pastures would experience the greatest variability in Soil Health Scores. 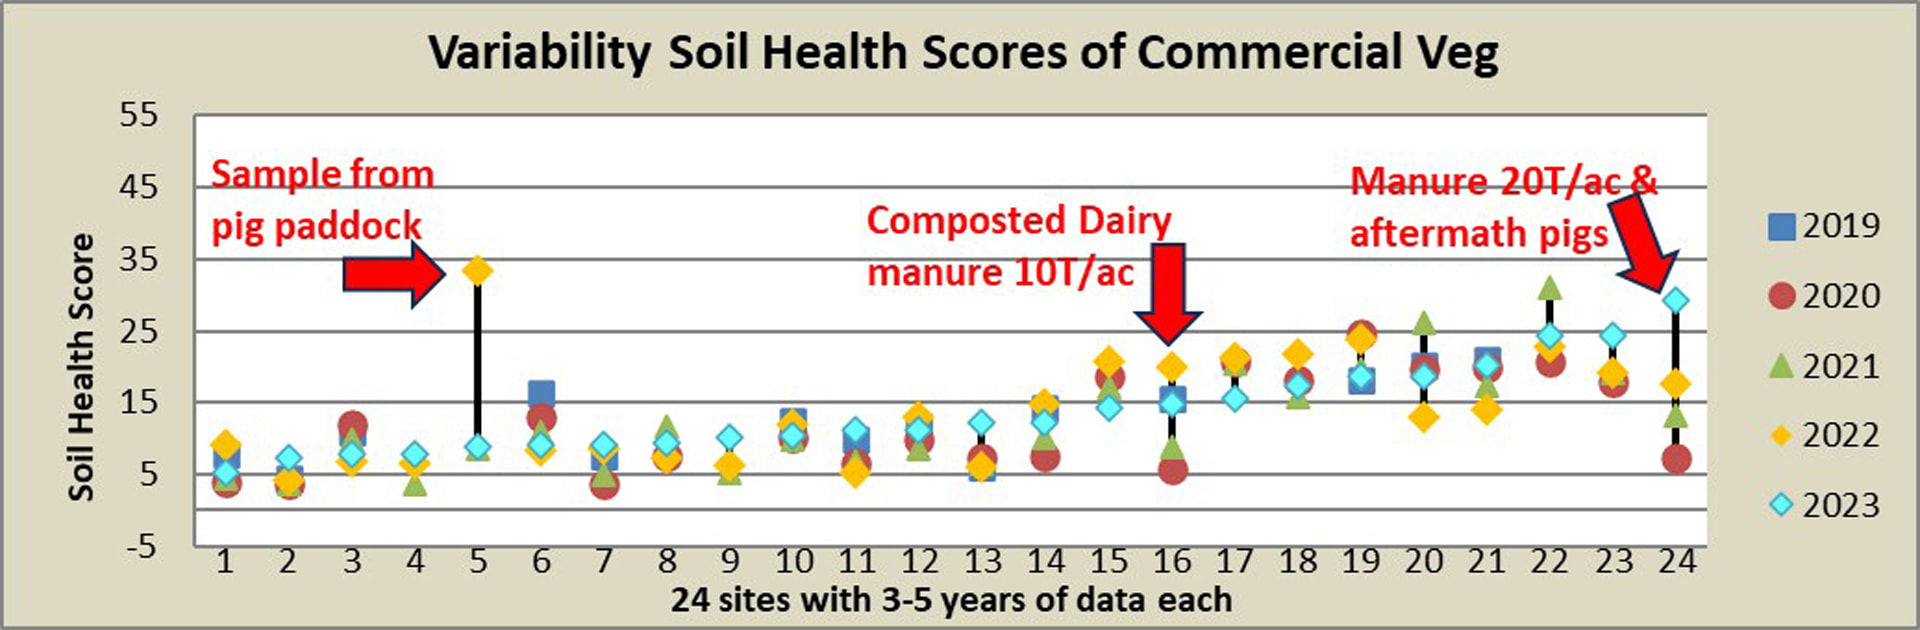 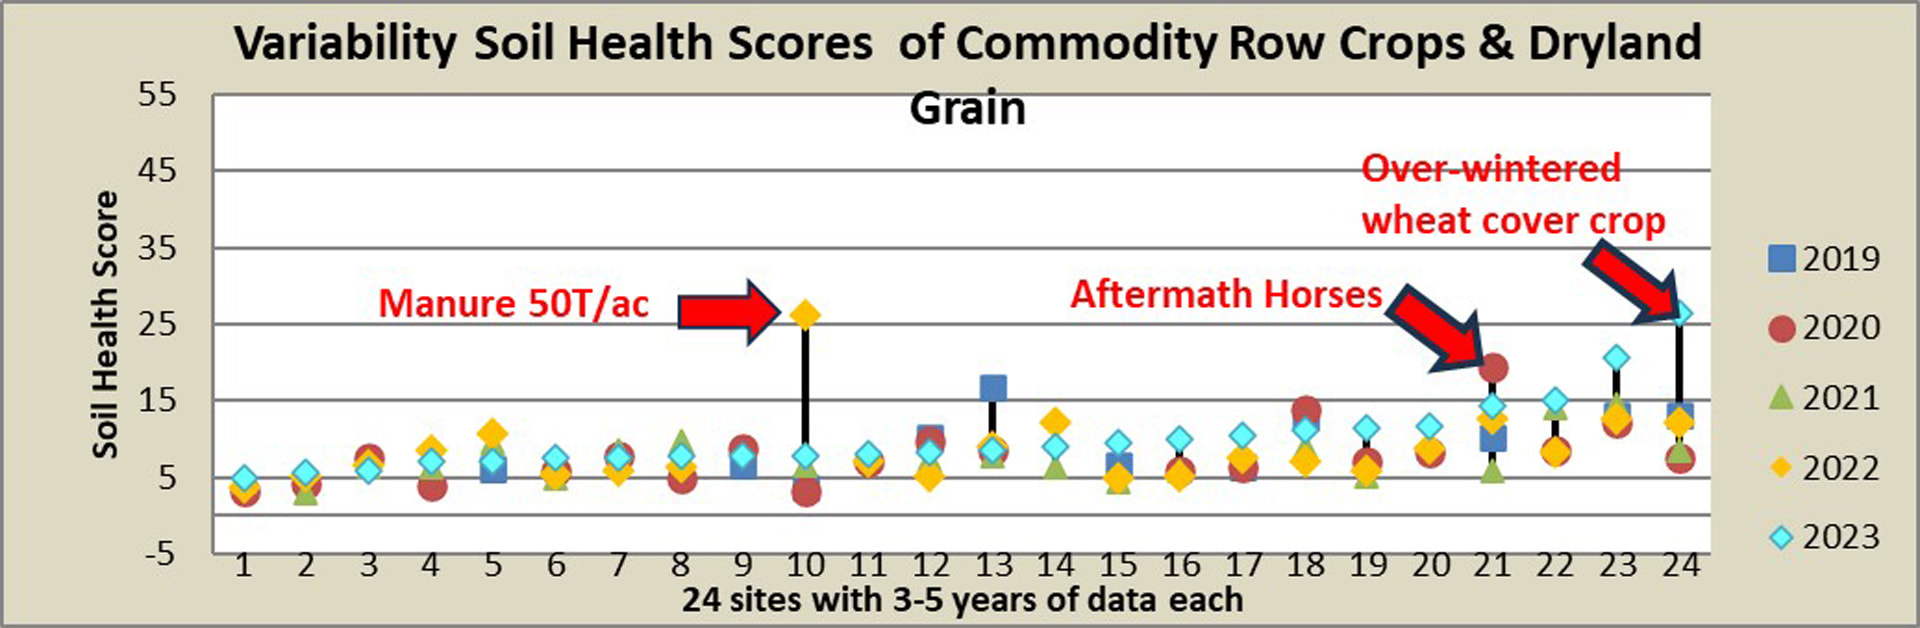 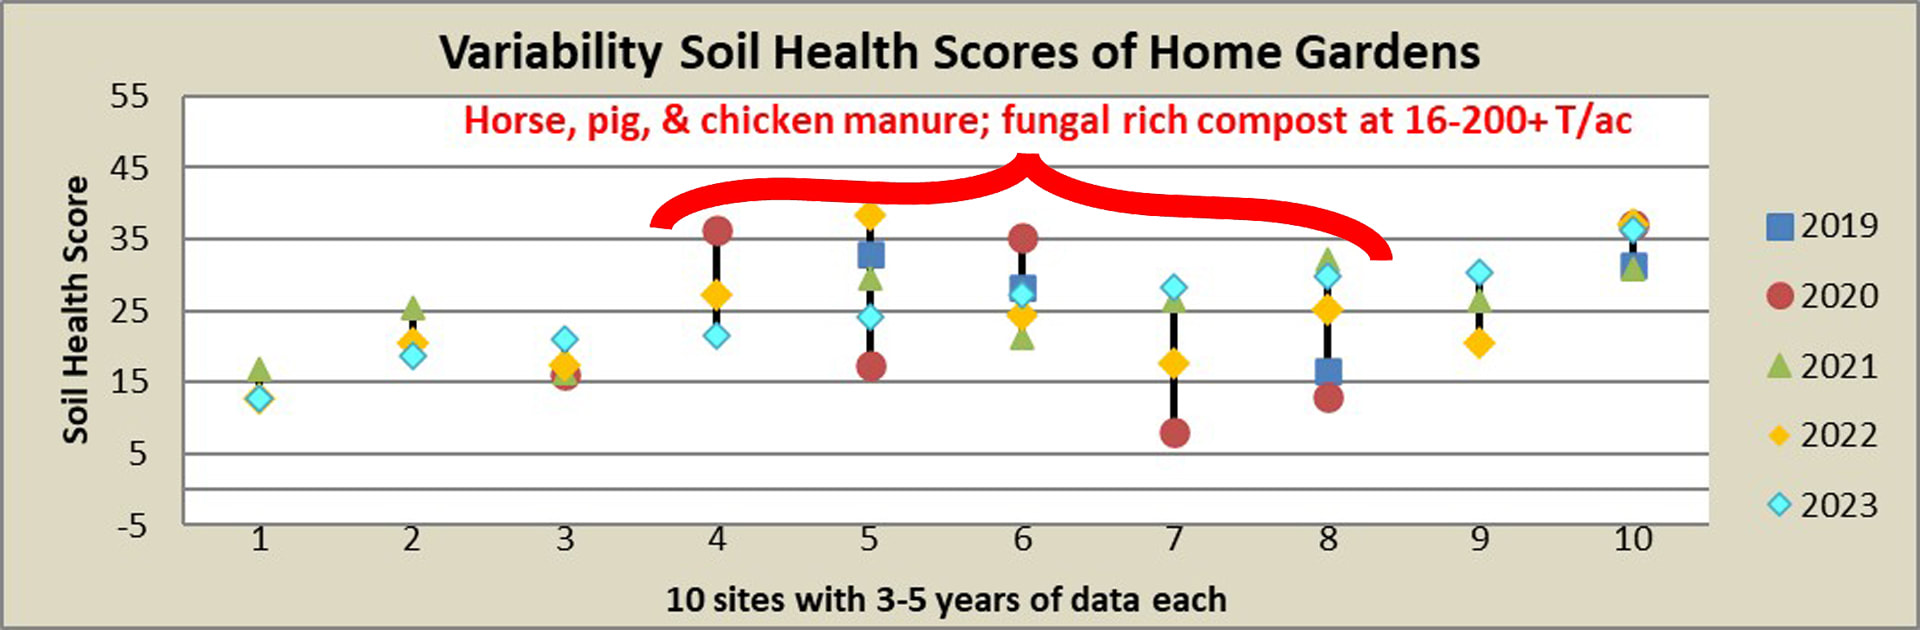 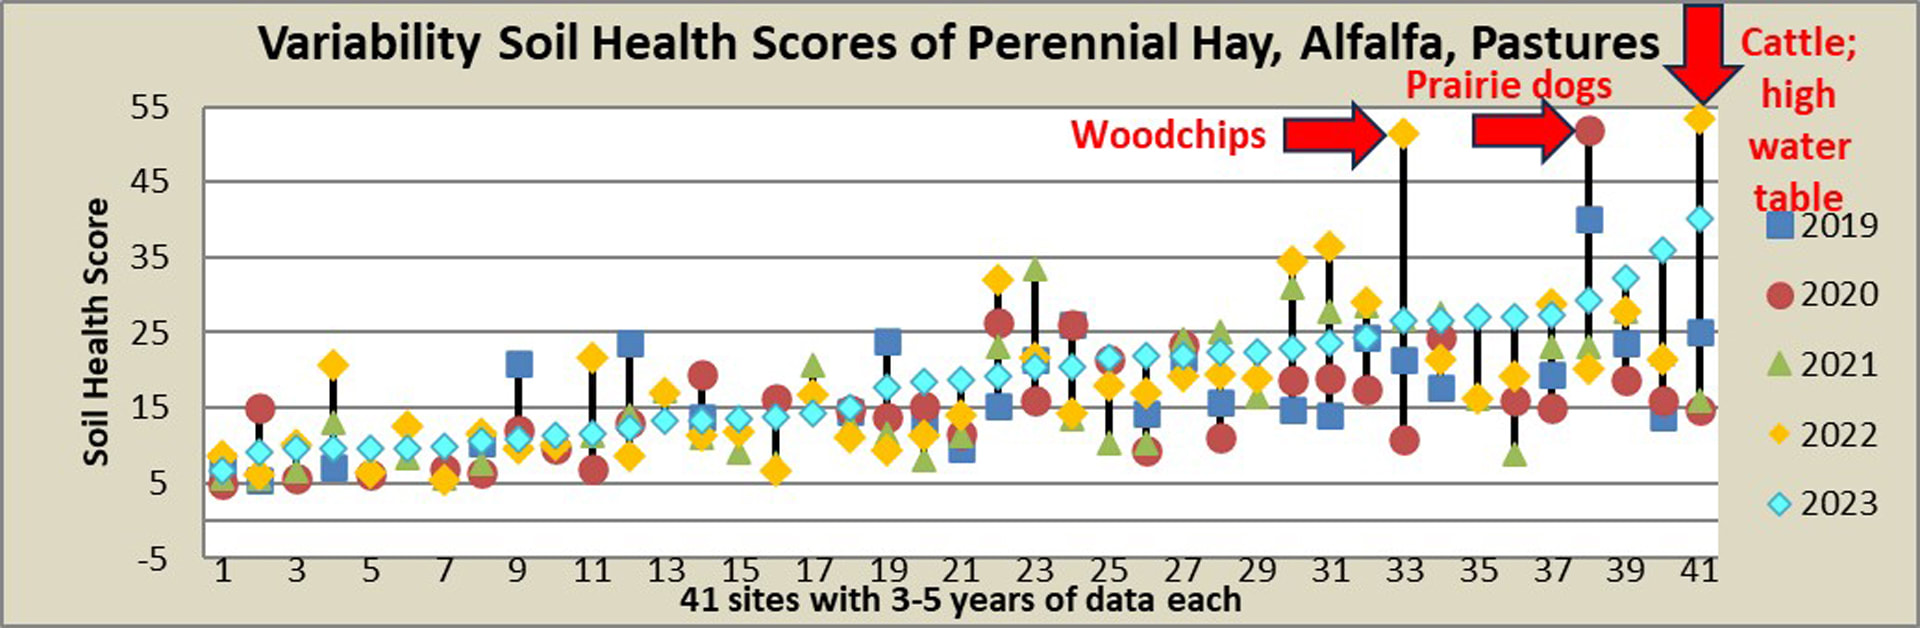 We continue to see a great deal of variability in our lab results when we compare sites with themselves year-to-year. We divided our sites into 4 crop categories (Commercial Veg/Flower/Fruit; Commodity Row Crops and Dryland Grains; Home Gardens; and Perennial Hay/Alfalfa/Pastures) and examined each category’s variability. These 4 graphs show that an examination of past practices can often explain some of the exceptionally big jumps in variability which we see in every crop group.
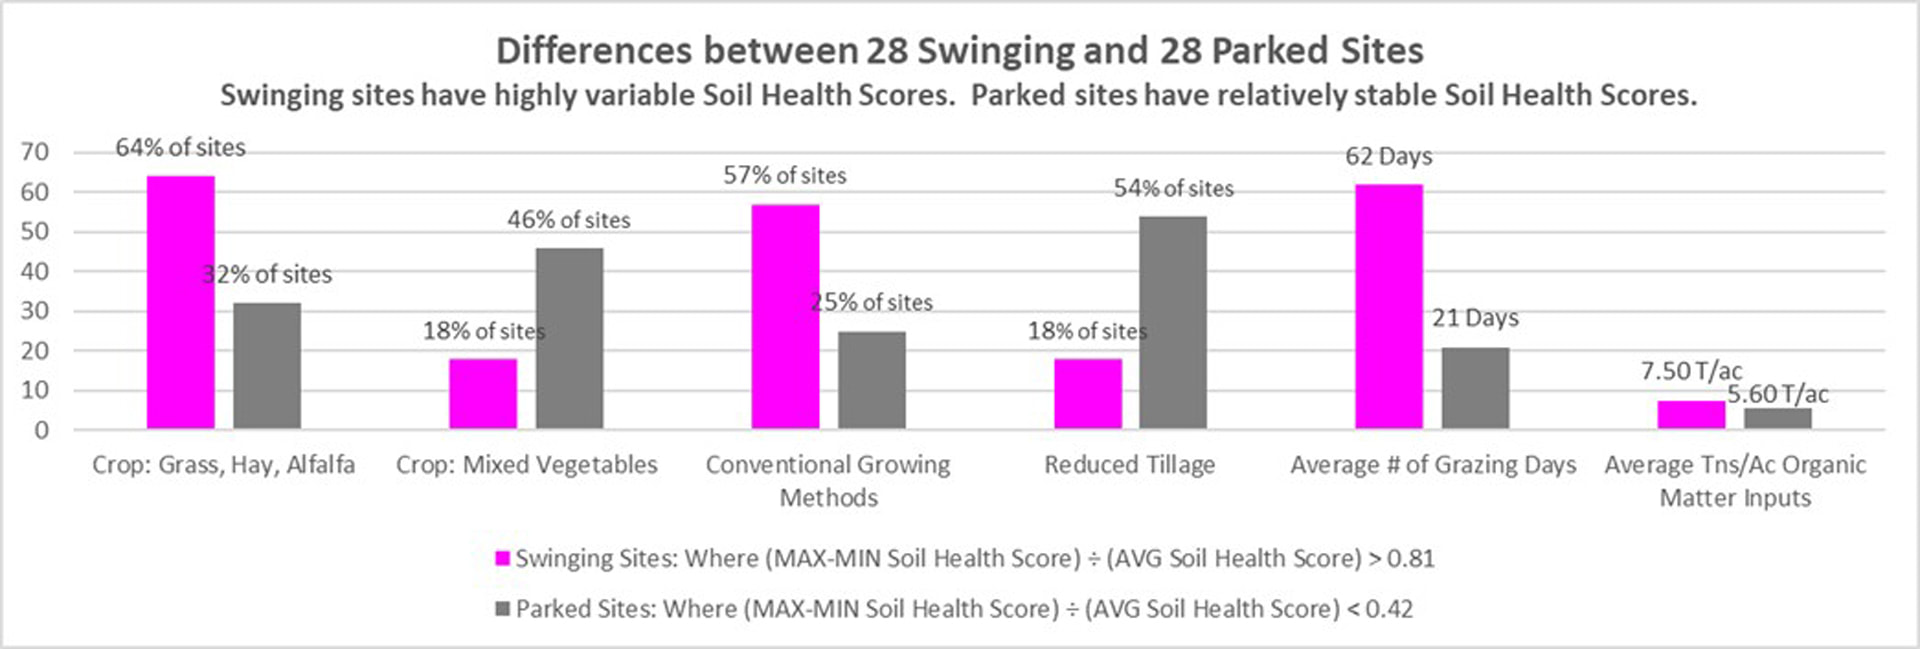 There are significant differences between our sites with the most variable soil health scores (our Swingers) and our sites with the least variable scores (our Parked sites). The most significant difference between the 2 groups is that Swinging sites have 3 times the number of average grazing days as Parked sites. While Swinging and Parked sites have the same numbers of sites with grazing animals, Swinging sites have animals grazing on-site for a much longer period of time. 2/3rds of Swinging sites are pastures, and the majority of Swinging sites use conventional growing methods. Swinging sites also apply an average of 7.5 T/acre of organic matter inputs, almost 50% more than Parked Sites at 5.6 T/ac. These findings support our 2023 findings that more grazing animals and organic matter inputs increase variability.
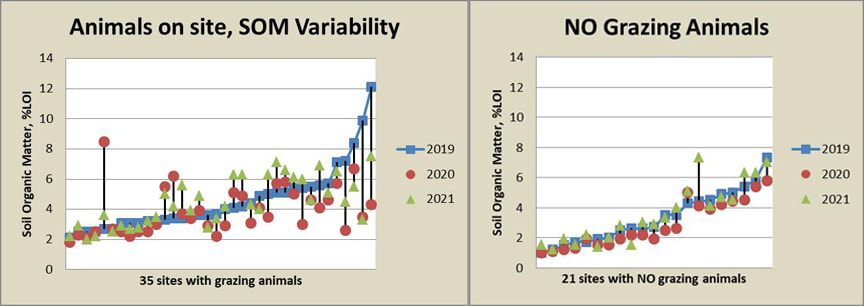
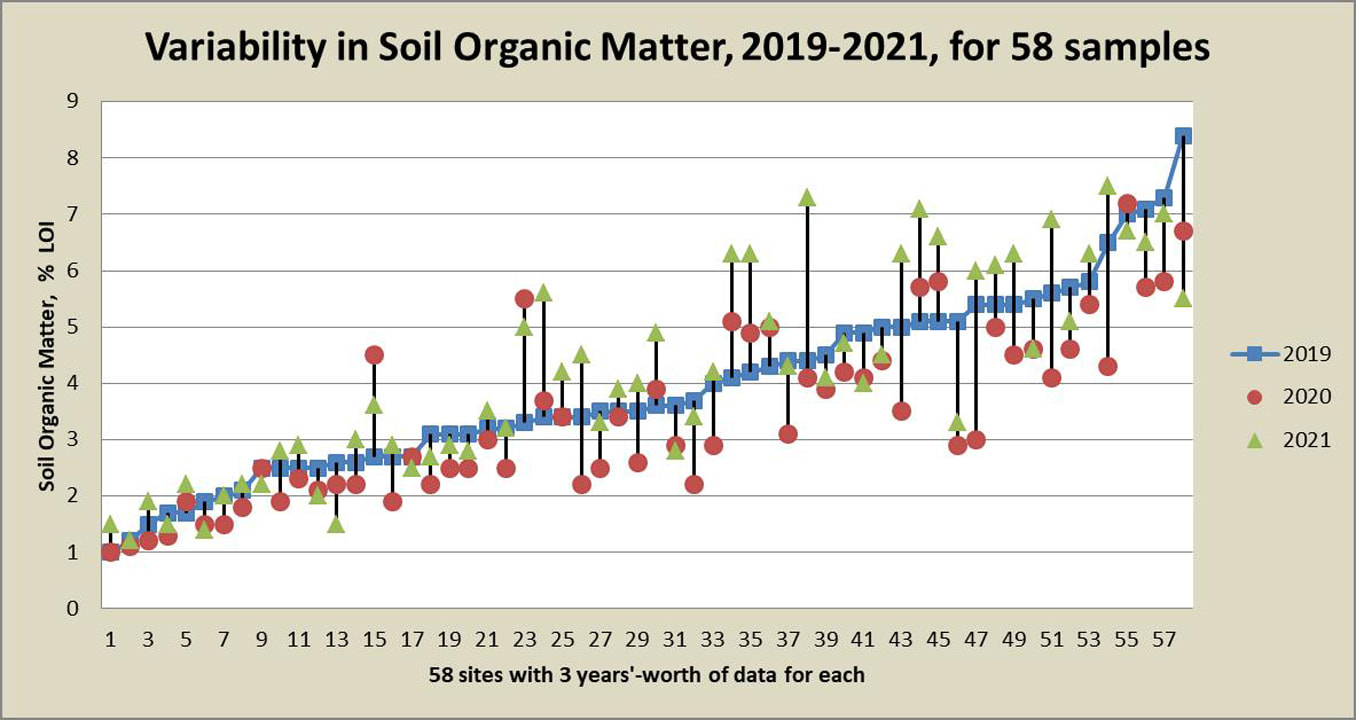
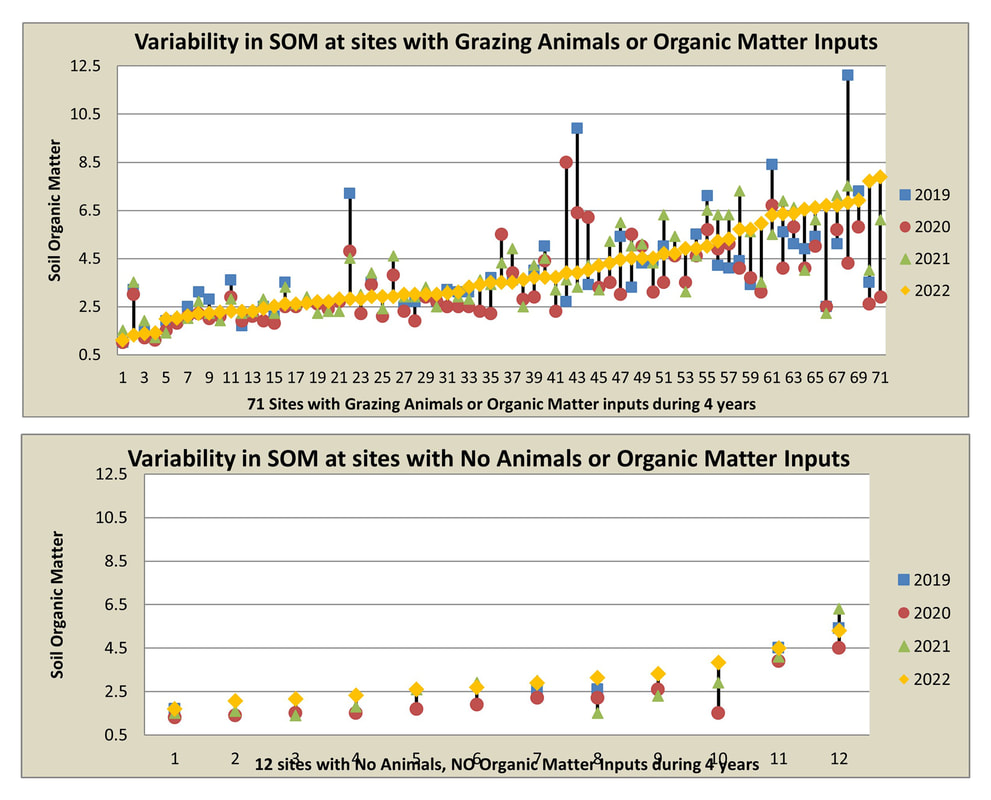 In the top graph above, 71 sites with both grazing animals and organic matter inputs (OMI) are each represented by a quadruplet of data points connected by a vertical black line (a blue square for 2019, red circle for 2020, green triangle for 2021, and yellow diamond for 2022). Each square-circle-triangle-diamond-black-line combo represents the Soil Organic Matter (SOM) values for one site for 4 years. According to the literature, SOM is supposed to be quite stable and very difficult to change, and yet we are seeing large swings in individual sites’ SOM data, especially when grazing animals are present or organic matter is imported to the site, as is the case in the top graph above.
We only have 12 sites in our study which have no grazing animals or imported organic matter for 3 or more years. The second lower graph shows that the variability in SOM values for these 12 sites is much less than for sites with grazing animals or organic matter inputs.  We examined our 28 sites which have the most variability in their soil health scores. We call these sites our “Swingers”, and they are evenly split between organic and conventional growing methods. Over half the “Swinger” sites are pastures with the rest split evenly between home gardens and commercial vegetable sites. Their most common crop is grass hay with mixed vegetables coming in second. Their average water season is 127 days long. “Swinger” sites have an average soil health score of 27.6, which is very high, especially for Colorado. The growers of these “Swinger” sites are all Soiley Award winners or nominees. They have adopted many soil health practices, as you can see in the following graph. 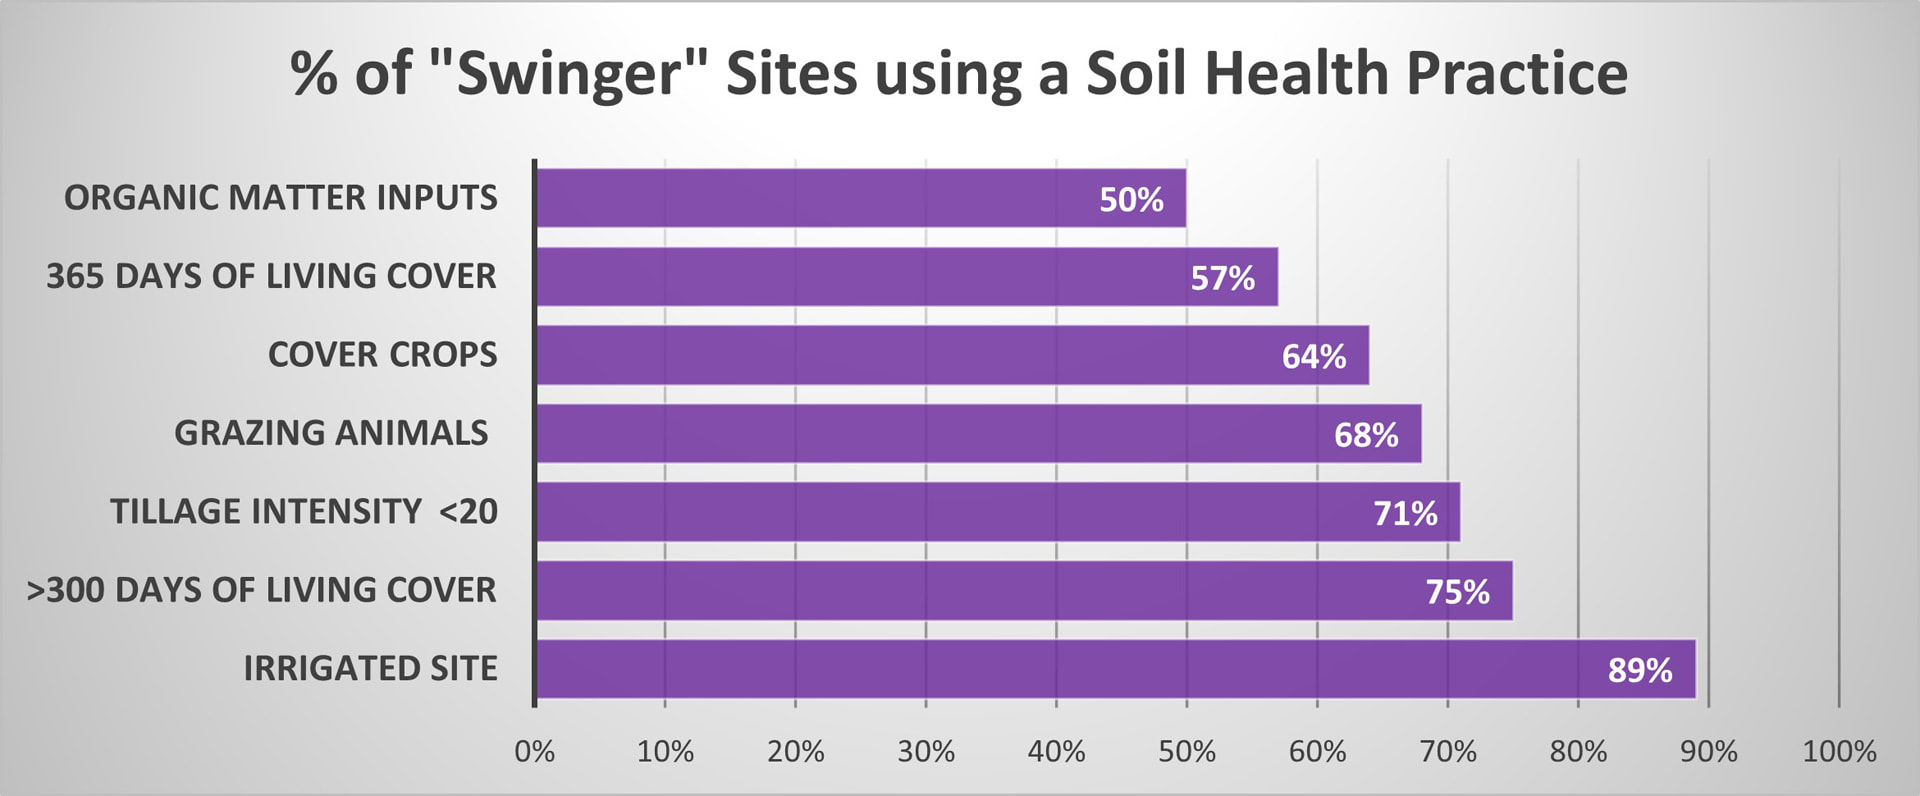 The lesson here seems to be that no good deed goes unpunished. It seems that one result of adopting good soil health practices may be a great deal of variability in soil health lab results. If you see your Haney test results bouncing around a lot, year-to-year, it does not necessarily mean that you are doing anything wrong. It may mean that you are doing many things right! We will explore this hypothesis further in coming years as we gather more data.
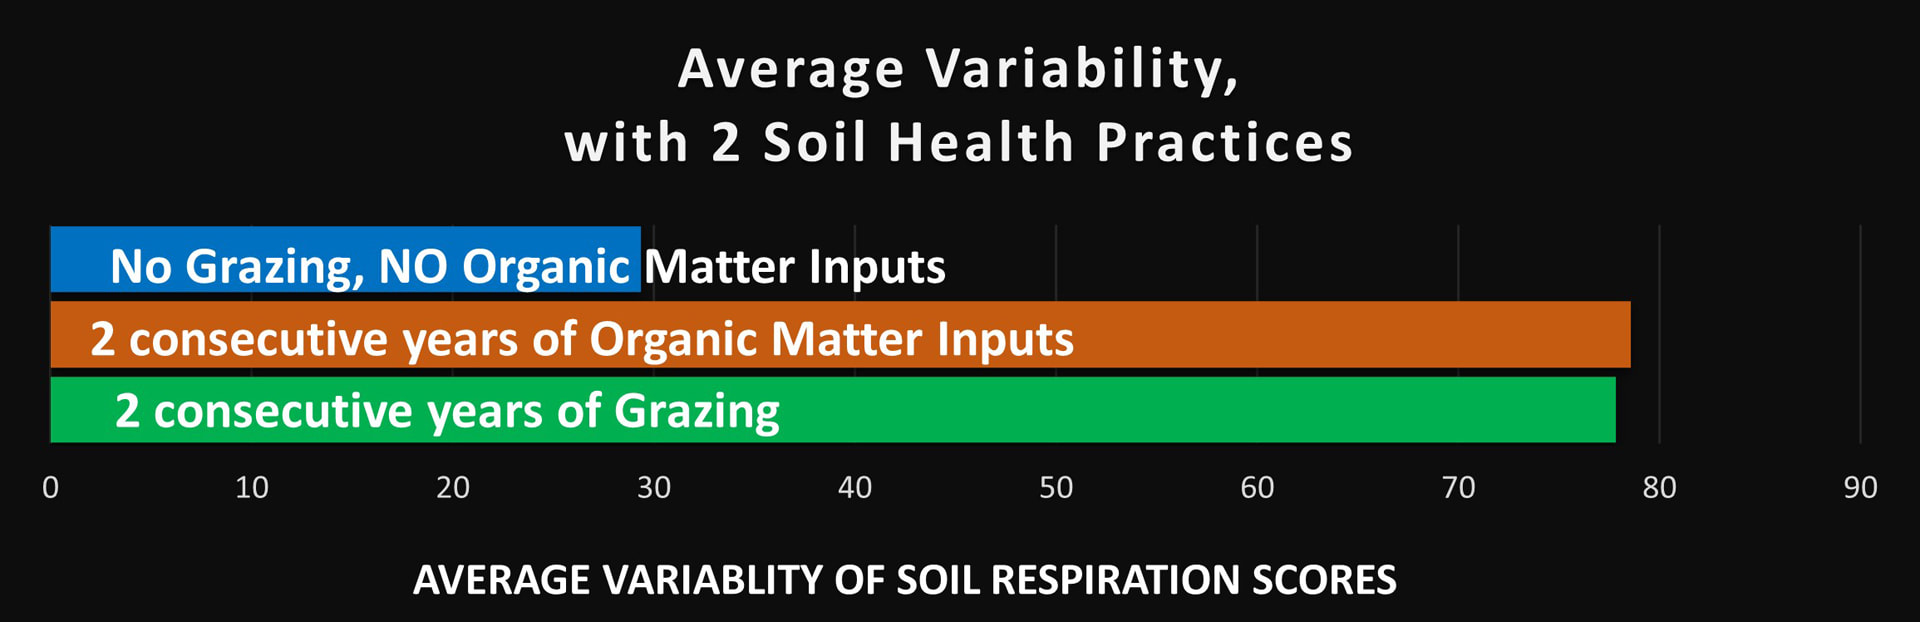 We sorted our sites into 3 groups and calculated the average variability for each group. This bar graph shows that the groups which grazed animals or added organic matter to their sites for 2 consecutive years have approximately three times as much variability in their lab results as the group with NO grazing animals and NO organic matter inputs.
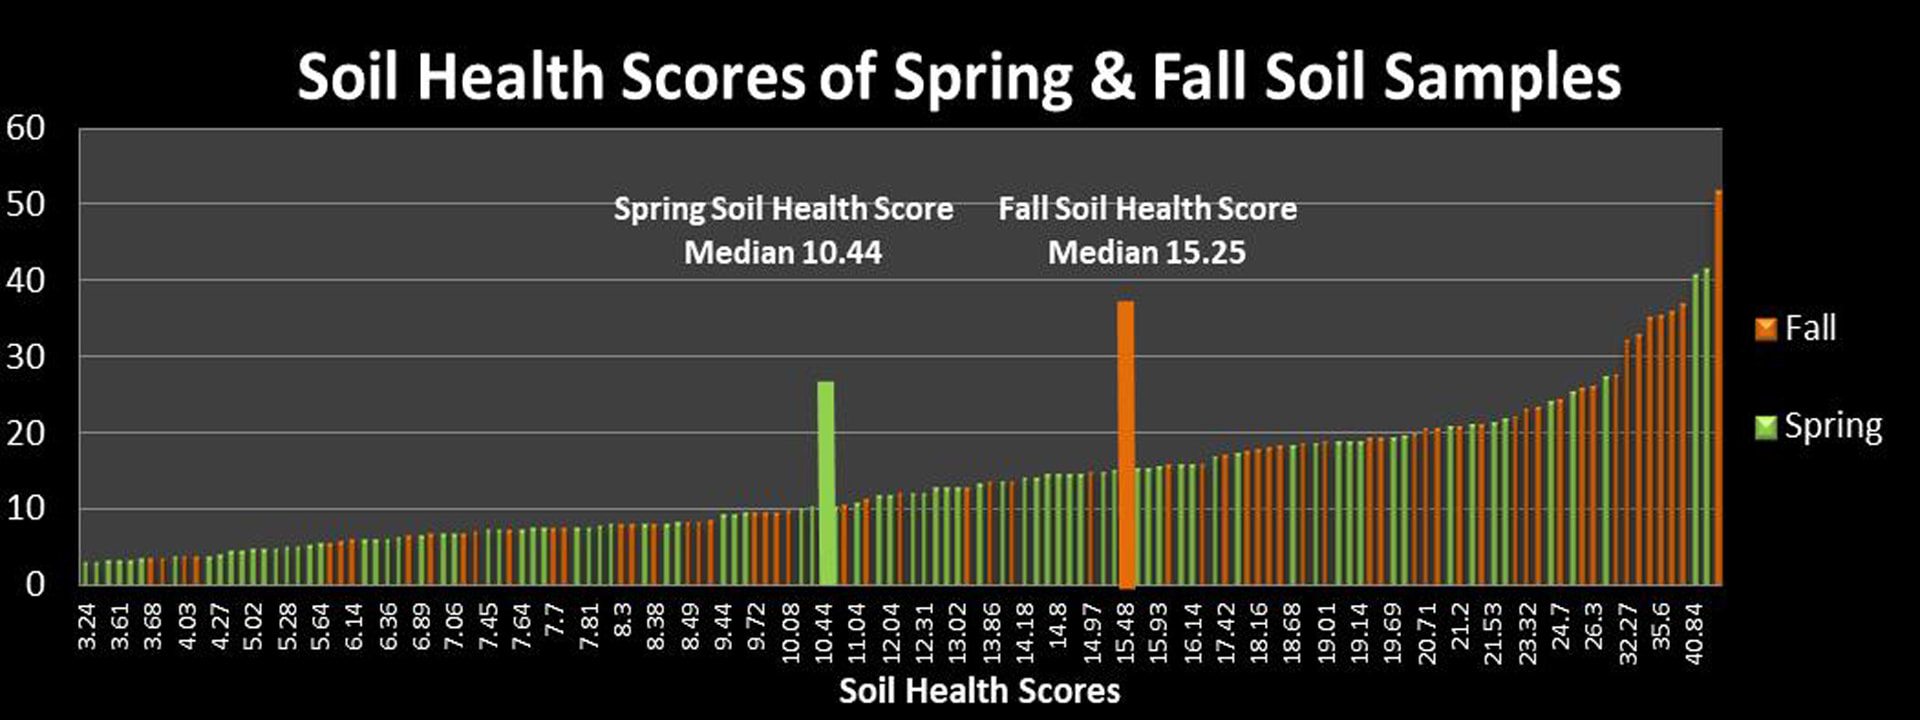
Soil samples collected in the spring have lower scores than samples collected in the fall.8/15/2022
|
AuthorElizabeth Black is the producer of the Citizen Science Soil Health Project Archives
March 2024
Categories
All
|
|
|
 RSS Feed